Original file (816 × 1,023 pixels, file size: 100 KB, MIME type: image/png)
Summary
Summary
| Description |
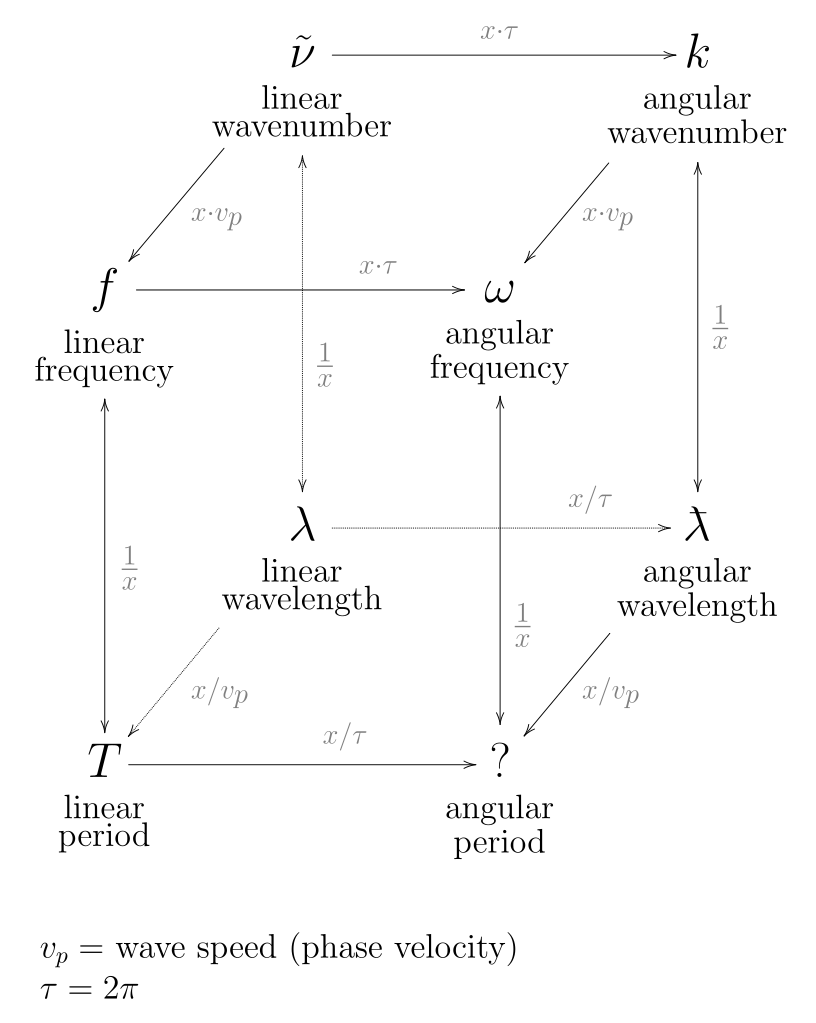
English: This diagram describes the relationships between the various properties of harmonic waves: frequency, period, wavelength, angular frequency, and wavenumber. The properties are organized in three axes: * linear properties on the left, and their angular equivalents on the right; * frequency properties on the top, and their periodic reciprocals on the bottom; * temporal properties at the front, and their spatial equivalents at the back. |
|---|---|
| Source |
Own work |
| Date |
2016-10-01 |
| Author | |
| Permission (Reusing this file) |
See below.
|
LaTeX source code
The source code below was developed interactively using the ShareLaTeX online editor. It makes use of the xymatrix package, and uses a command definition from TeX.StackExchange do draw the barred lambda character.
To generate the SVG image, the LaTeX document was exported from ShareLaTeX as a PDF file, converted to SVG using Online-Convert.com, and cleaned-up (grouping related objects, tweaking positioning of some elements) using Inkscape.
\documentclass{article}
\usepackage[all]{xy}
\usepackage{amsmath,xcolor}
\newcommand{\lambdabar}{{\mkern0.75mu\mathchar '26\mkern -9.75mu\lambda}}
\begin{document}
\noindent
\pagestyle{empty}
\huge
\[
	\xymatrix@C=0.5em@R+1em{
	& \underset{_{\substack{\text{linear}\\\text{wavenumber}}}}{\tilde{\nu}}
	\ar^-{_{\color{gray}x \cdot \tau}}[rr]
	\ar^>>>>>>>>>>>>>>>>>>>>{\color{gray}\frac{1}{x}}@{<.>}[dd]
	\ar_-{_{\color{gray}x \cdot v_p}}[dl]
	&
	& \underset{_{\substack{\text{angular}\\\text{wavenumber}}}}{k}
	\ar^-{_{\color{gray}x \cdot v_p}}[dl]
	\ar^-{\color{gray}\frac{1}{x}}@{<->}[dd]
	\\
	\underset{_{\substack{\text{linear}\\\text{frequency}}}}{f}
	\ar^{_{\color{gray}\qquad\;\; x \cdot \tau}}[rr]
	&
	& \underset{_{\substack{\text{angular}\\\text{frequency}}}}{\omega}
	\ar^>>>>>>>>>>>>>>>>>>>>{\color{gray}\frac{1}{x}}@{<->}[dd]
	\\
	& \underset{_{\substack{\text{linear}\\\text{wavelength}}}}{\lambda}
	\ar^-{_{\qquad\quad\color{gray}x/\tau}}@{.>}[rr]
	\ar^>>>>>>>>>>>>>>>{_{\color{gray}x / v_p}}@{.>}[dl]
	&
	& \underset{_{\substack{\text{angular}\\\text{wavelength}}}}{\lambdabar}
	\ar^-{_{\color{gray}x / v_p}}[dl]
	\\
	\underset{_{\substack{\text{linear}\\\text{period}}}}{T}
	\ar^-{\color{gray}\frac{1}{x}}@{<->}[uu]
	\ar^-{_{\color{gray}x / \tau}}[rr]
	&
	& \underset{_{\substack{\text{angular}\\\text{period}}}}{?}
	}
\]

\vspace{1em}
\Large

$v_p =$ wave speed (phase velocity)

$\tau = 2\pi$
\end{document}
Licensing
I, the copyright holder of this work, hereby publish it under the following license:
|
File history
Click on a date/time to view the file as it appeared at that time.
| Date/Time | Thumbnail | Dimensions | User | Comment | |
|---|---|---|---|---|---|
| current | 14:02, 22 March 2024 | | 816 × 1,023 (100 KB) | Isidore (talk | contribs) | =={{int:filedesc}}== {{Information | description = {{en|1=This diagram describes the relationships between the various properties of harmonic waves: frequency, period, wavelength, angular frequency, and wavenumber. The properties are organized in three axes: * linear properties on the left, and their angular equivalents on the right; * frequency properties on the top, and their periodic reciprocals on... |
You cannot overwrite this file.
File usage
The following file is a duplicate of this file (more details):
There are no pages that use this file.