Size of this preview: 800 × 534 pixels. Other resolution: 1,024 × 683 pixels.
Original file (1,024 × 683 pixels, file size: 64 KB, MIME type: image/png)
Summary
Summary
| Description |
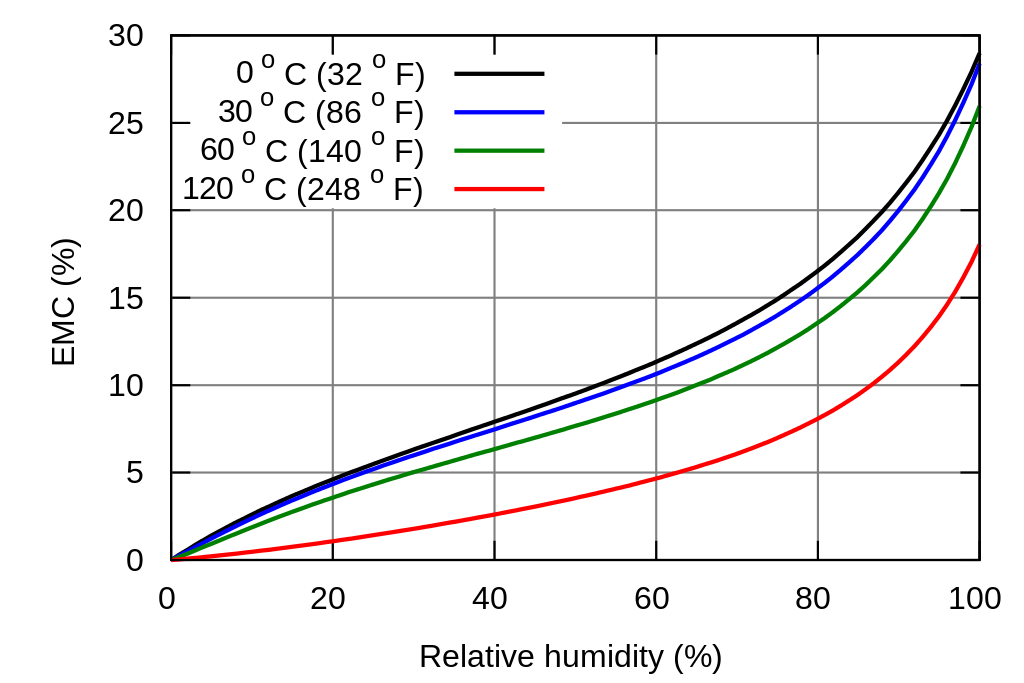
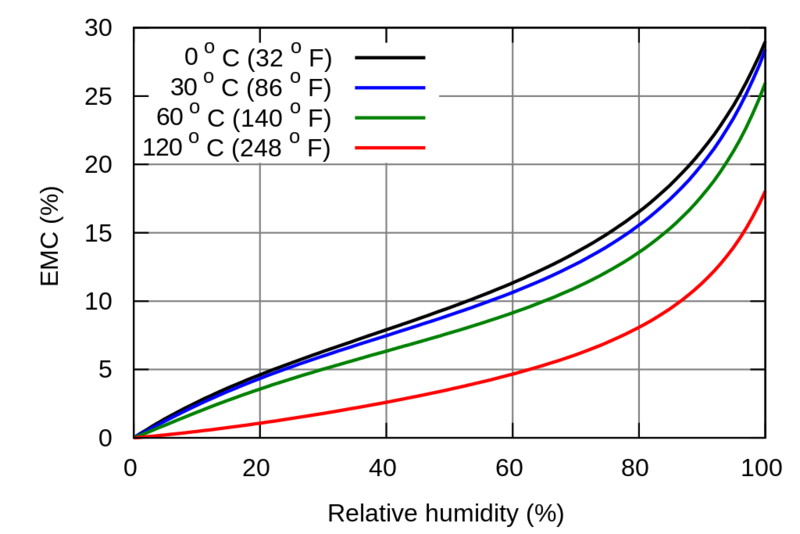
English: Equilibrium moisture content of wood versus relative humidity of the surrounding air. |
|---|---|
| Source |
Own work |
| Date |
2010-12-31 |
| Author | |
| Permission (Reusing this file) |
See below.
|
Licensing
I, the copyright holder of this work, hereby publish it under the following licenses:
You may select the license of your choice.
|


File history
Click on a date/time to view the file as it appeared at that time.
| Date/Time | Thumbnail | Dimensions | User | Comment | |
|---|---|---|---|---|---|
| current | 09:19, 7 January 2024 | | 1,024 × 683 (64 KB) | Isidore (talk | contribs) | == {{int:filedesc}} == {{Information |description={{en|1={{W|Equilibrium moisture content}} of wood versus relative humidity of the surrounding air. }} |source={{own}} |author={{U|Hankwang}} |date=2010-12-31 |other fields={{Igen|G|+|%r|s=ch|nt=|c1= # Gnuplot script to generate EMC plot, for Gnuplot version 4.2. # Author: User hankwang on Wikipedia (2010). # Equations taken from the Wikipedia article as of 2010-12-31. # TF = temperature in deg F, TC = temp. in deg C W(TF) = 330 + 0.452*TF... |
You cannot overwrite this file.
File usage
The following page uses this file: