Size of this preview: 691 × 600 pixels. Other resolution: 1,180 × 1,024 pixels.
Original file (1,180 × 1,024 pixels, file size: 37 KB, MIME type: image/png)
Summary
| Description |
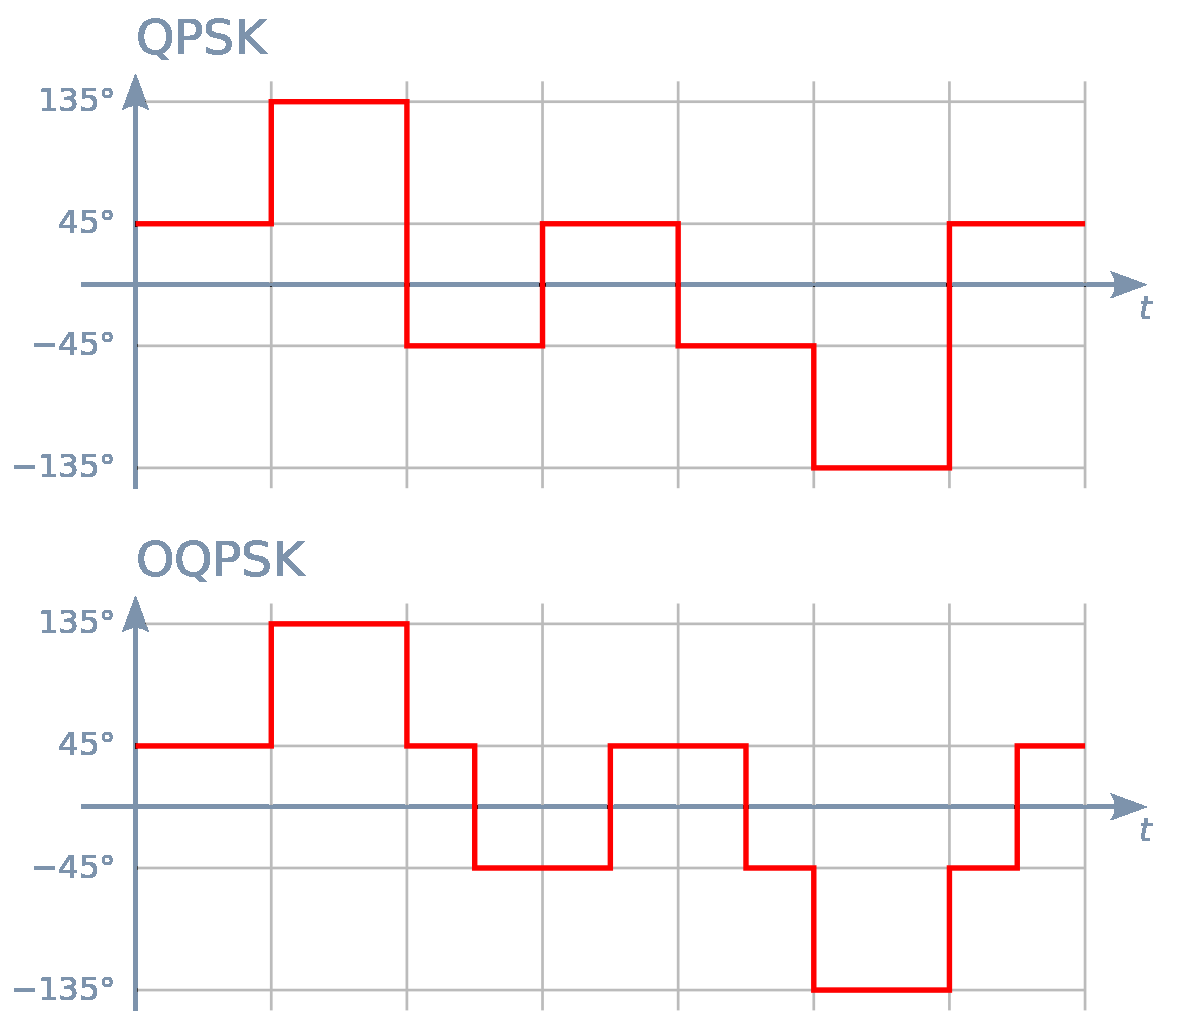
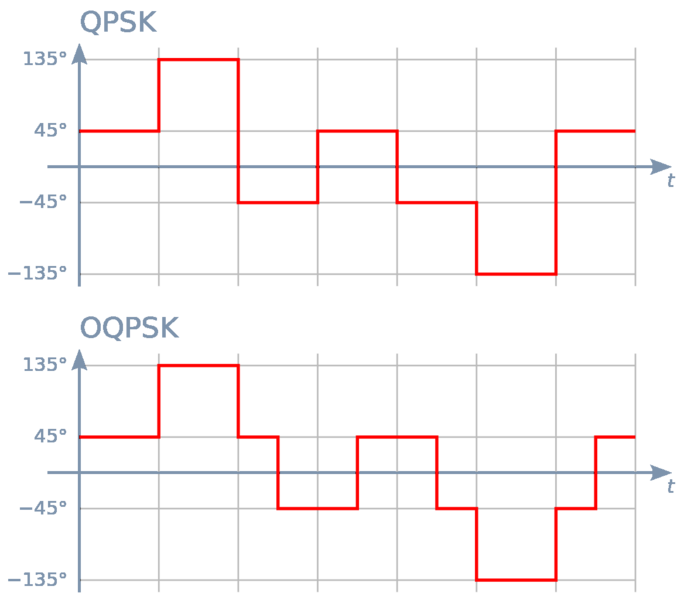
English: The picture shows first the plot of the phase in a standard QPSK modulation. Then it shows how the plot changes using OQPSK: the behaviour is smoother since all the 180-degrees jumps are removed. | ||||||
|---|---|---|---|---|---|---|---|
| Source | |||||||
| Date |
2008-07-01 23:29 (UTC) | ||||||
| Author |
| ||||||
| Permission (Reusing this file) |
|


File history
Click on a date/time to view the file as it appeared at that time.
| Date/Time | Thumbnail | Dimensions | User | Comment | |
|---|---|---|---|---|---|
| current | 17:28, 20 January 2024 | | 1,180 × 1,024 (37 KB) | Isidore (talk | contribs) | {{Information |Description={{en|The picture shows first the plot of the phase in a standard QPSK modulation. Then it shows how the plot changes using OQPSK: the behaviour is smoother since all the 180-degrees jumps are removed.}} |Source=*Oqpsk_phase_plot.png |Date=2008-07-01 23:29 (UTC) |Author=* This hand-crafted SVG version by Qef (talk) * Original bitmap Oqpsk_phase_plot.png created in Dia by [[... |
You cannot overwrite this file.
File usage
The following page uses this file: