Size of this preview: 800 × 559 pixels. Other resolution: 1,169 × 817 pixels.
Original file (1,169 × 817 pixels, file size: 70 KB, MIME type: image/png)
Summary
| Description |
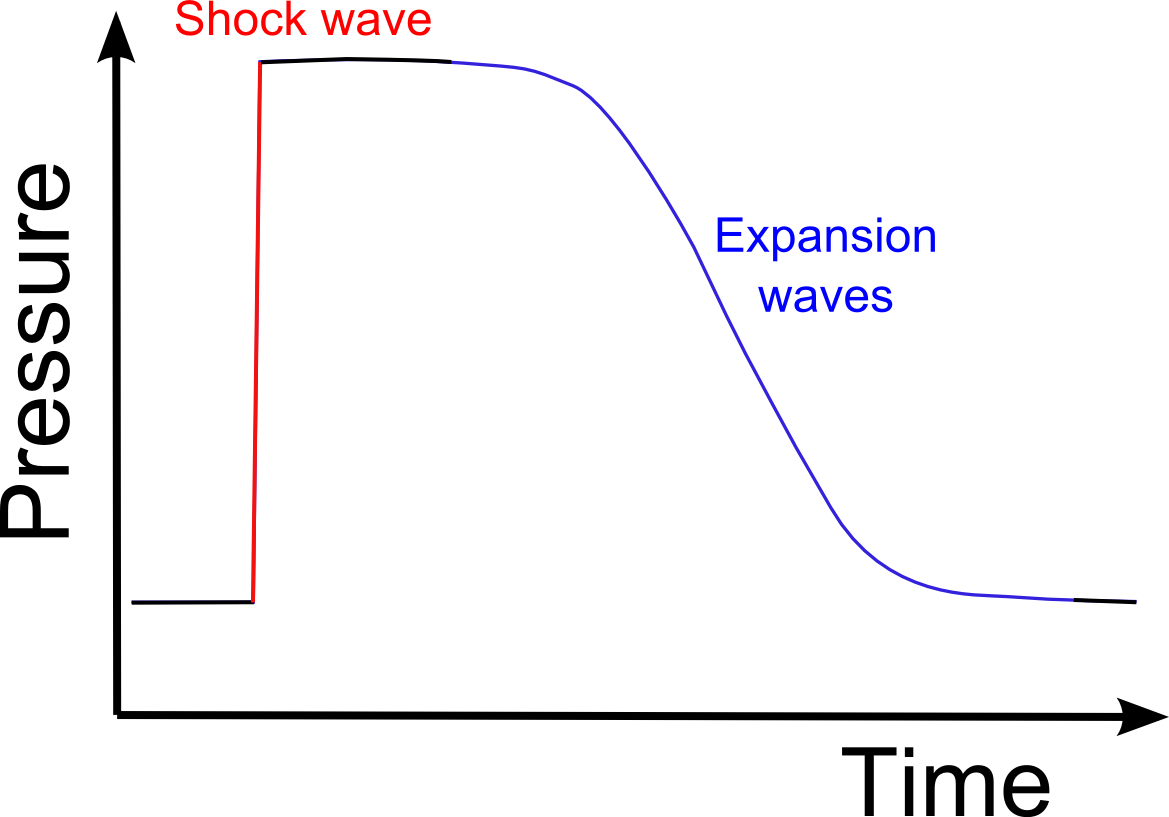
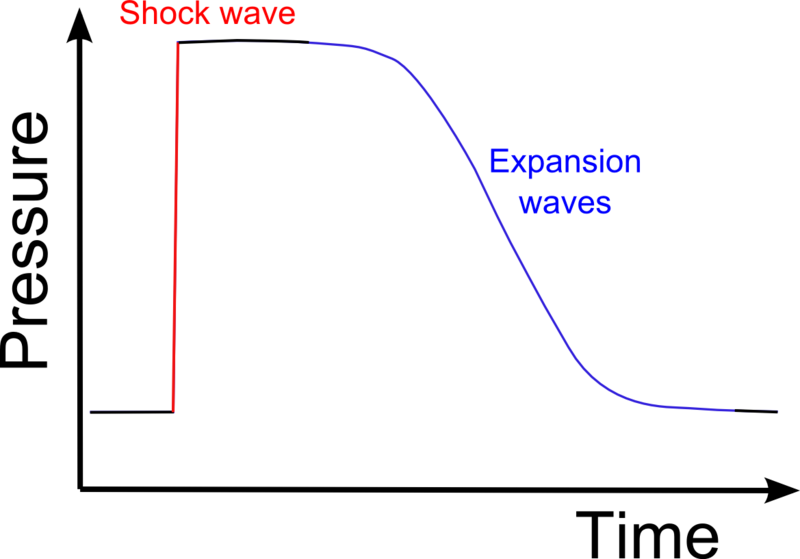
English: The figure shows the variation in pressure behind a shock wave followed by expansion waves. The shock wave leads to an abrupt rise in the pressure. |
|---|---|
| Source |
self-made in en:Inkscape. (The SVG version of the file is here.) |
| Date | |
| Author | |
| Permission (Reusing this file) |
(Template:Original text) Template:PD-user-en
|
⧼wm-license-original-upload-log⧽
Template:Transferred from Template:Original description page
- 2007-03-09 04:54 Mythealias 1169×817×8 (72019 bytes) {{Information| |Description = The figure shows the variation in pressure behind a shock wave followed by expansion waves. The shock wave leads to an abrupt rise in the pressure. |Source = self-made in [[Inkscape]]. (The SVG version of the file is [[:Image
File history
Click on a date/time to view the file as it appeared at that time.
| Date/Time | Thumbnail | Dimensions | User | Comment | |
|---|---|---|---|---|---|
| current | 13:29, 22 March 2024 | | 1,169 × 817 (70 KB) | Isidore (talk | contribs) | {{Information |Description={{en|The figure shows the variation in pressure behind a shock wave followed by expansion waves. The shock wave leads to an abrupt rise in the pressure.}} |Source=self-made in en:Inkscape. (The SVG version of the file is here.) |Date={{original upload date|2007-03-09}}<br/> ({{original text|nobold=1|1=created 8th Mar 2007.}}) |Author=-- Myth (Talk) 04:54, 9 March 2007 (UTC) |Pe... |
You cannot overwrite this file.
File usage
The following page uses this file: