Size of this preview: 800 × 600 pixels. Other resolution: 1,280 × 960 pixels.
Original file (1,280 × 960 pixels, file size: 75 KB, MIME type: image/png)
Summary
Summary
| Description |
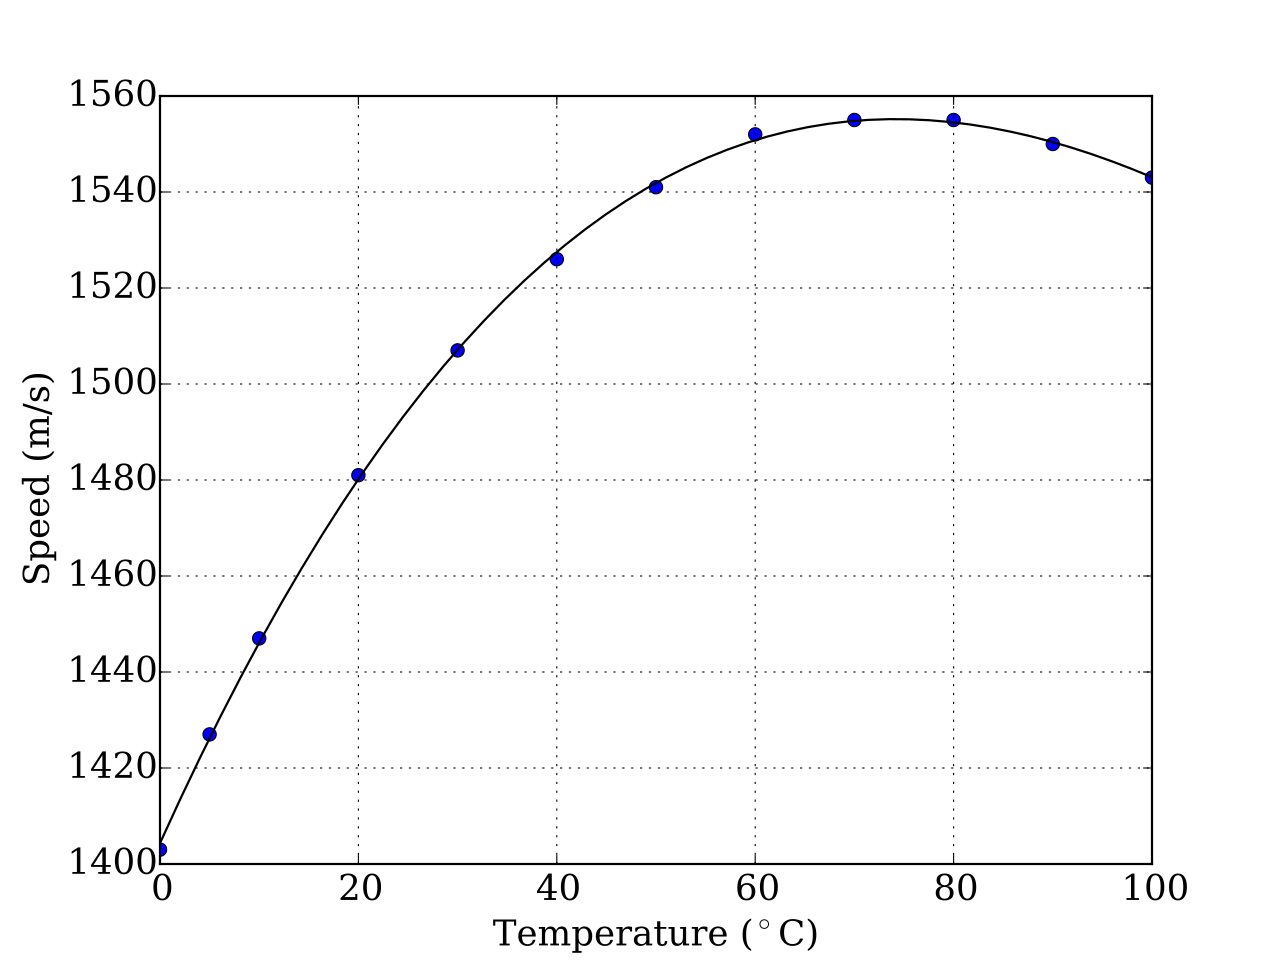
English: Graph of the speed of sound in water vs temperature. Tabulated values (circle markers) from "The Engineering Toolbox" [1]. Smooth continuous line is a 3rd degree polynomial fit (see below) calculated on the tabulated data, accurate within 0.1%. C(T) = a0 + a1T + a2T2 + a3T3 (m/s) """
Plot of the speed of sound versus temperature in water
The data is obtained from "The Engineering Toolbox" [1]_
References
----------
.. [1] The Engineering Toolbox. Water - Speed of Sound.
Accesed: April 27, 2015.
http://www.engineeringtoolbox.com/sound-speed-water-d_598.html
"""
import numpy as np
import matplotlib.pyplot as plt
from matplotlib import rcParams
rcParams['font.family'] = 'serif'
rcParams['font.size'] = 16
data = np.array([
[ 0., 1403.],
[ 5., 1427.],
[ 10., 1447.],
[ 20., 1481.],
[ 30., 1507.],
[ 40., 1526.],
[ 50., 1541.],
[ 60., 1552.],
[ 70., 1555.],
[ 80., 1555.],
[ 90., 1550.],
[ 100., 1543.]])
temp = data[:, 0]
vel = data[:, 1]
a3, a2, a1, a0 = np.polyfit(temp, vel, 3)
temp_fit = np.linspace(0,100)
vel_fit = a0 + a1*temp_fit + a2*temp_fit**2 + a3*temp_fit**3
plt.plot(temp, vel, 'o')
plt.plot(temp_fit, vel_fit, 'k')
plt.grid(True)
plt.xlabel(r"Temperature ($^\circ$C)")
plt.ylabel(r"Speed (m/s)")
plt.savefig("Speed_of_sound_in_water.svg")
|
|---|---|
| Source |
Own work |
| Date |
2014-05-10 |
| Author |
K. Krallis, SV1XV |
| Permission (Reusing this file) |
See below.
|
Licensing
File history
Click on a date/time to view the file as it appeared at that time.
| Date/Time | Thumbnail | Dimensions | User | Comment | |
|---|---|---|---|---|---|
| current | 13:05, 22 March 2024 | | 1,280 × 960 (75 KB) | Isidore (talk | contribs) | == {{int:filedesc}} == {{Information |Description = {{en|1=Graph of the speed of sound in water vs temperature. Tabulated values (circle markers) from "The Engineering Toolbox" [http://www.engineeringtoolbox.com/sound-speed-water-d_598.html]. Smooth continuous line is a 3rd degree polynomial fit (see below) calculated on the tabulated data, accurate within 0.1%.}} {{es|1=Gráfico de la rapidez del sonido en el agua versus temperatura. Los datos tabulados (círculos) se obtuvieron de "The... |
You cannot overwrite this file.
File usage
The following page uses this file: