Size of this preview: 800 × 600 pixels. Other resolution: 1,024 × 768 pixels.
Original file (1,024 × 768 pixels, file size: 247 KB, MIME type: image/png)
Summary
Summary
| Description |
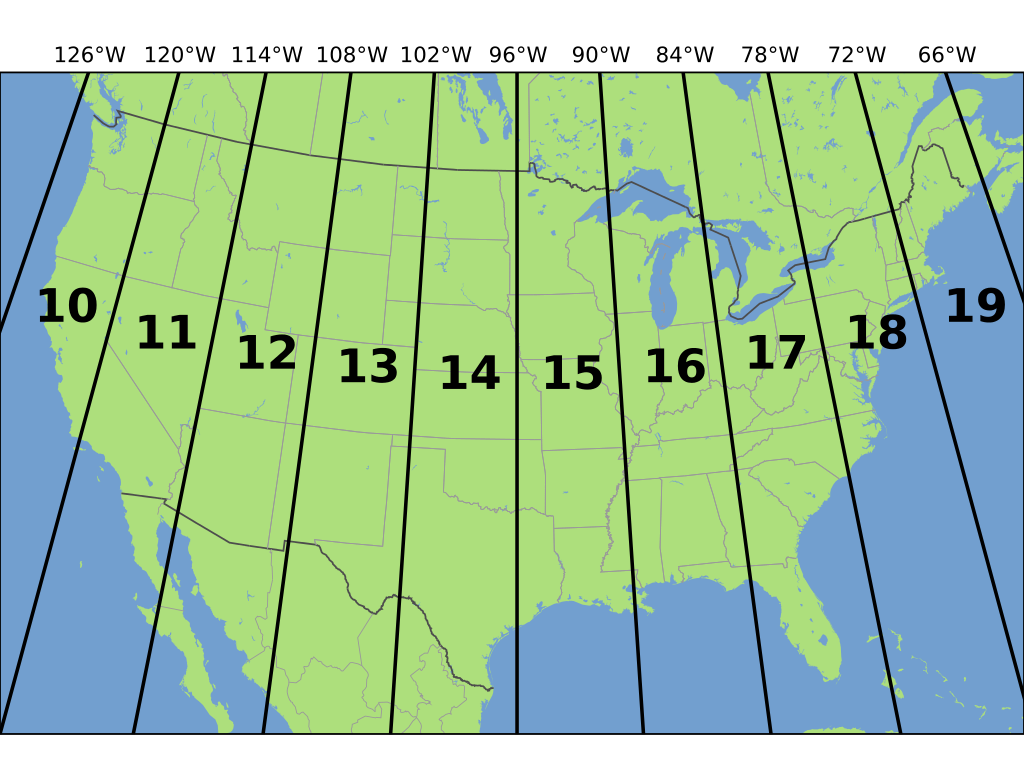
English: This image generated using the following python script: #!/usr/bin/env python
# -*- coding: utf-8 -*-
from mpl_toolkits.basemap import Basemap
import matplotlib; matplotlib.use('GTKCairo')
import pylab
# Setup figure, axes, and map projection
fig = pylab.figure()
fig.figurePatch.set_alpha(0.0)
ax = pylab.axes([0.,0.,1.0,0.95], axisbg=(0.4471,0.6235,0.8117))
bm = Basemap(projection='lcc', urcrnrlat=49, llcrnrlat=21, urcrnrlon=-61,
llcrnrlon=-120, lon_0=-96, lat_0=39, lat_1=33, lat_2=45,
resolution='i', ax=ax)
# Draw Borders
bm.fillcontinents((0.6784,0.8745, 0.4863))
bm.drawcountries(linewidth=1.0, color='0.3')
bm.drawstates(linewidth=0.5, color='0.6')
# Draw Meridians and Label UTM Zones
bm.drawmeridians(range(-300,126,6), linewidth=2, dashes=[1,0],
labels=[0,0,1,0], size=12)
for zone in range(1, 10):
x,y = bm(-180 + 6*zone - 3, 40)
pylab.text(x,y,'%d' % zone, horizontalalignment='center',
verticalalignment='center', size=26, weight='bold')
pylab.savefig('Utm-zones.svg')
|
|---|---|
| Source | |
| Date | |
| Author | |
| Permission (Reusing this file) |
See below.
|
Licensing
Template:User at project, the copyright holder of this work, hereby publishes it under the following license:
|
File history
Click on a date/time to view the file as it appeared at that time.
| Date/Time | Thumbnail | Dimensions | User | Comment | |
|---|---|---|---|---|---|
| current | 13:44, 22 January 2024 | | 1,024 × 768 (247 KB) | Isidore (talk | contribs) | == {{int:filedesc}} == {{Information |Description={{en|1=This image generated using the following python script: <source lang=python>#!/usr/bin/env python # -*- coding: utf-8 -*- from mpl_toolkits.basemap import Basemap import matplotlib; matplotlib.use('GTKCairo') import pylab # Setup figure, axes, and map projection fig = pylab.figure() fig.figurePatch.set_alpha(0.0) ax = pylab.axes([0.,0.,1.0,0.95], axisbg=(0.4471,0.6235,0.8117)) bm = Basemap(projection='lcc', urcrnrlat=49, llcrnrlat=21,... |
You cannot overwrite this file.
File usage
The following page uses this file: