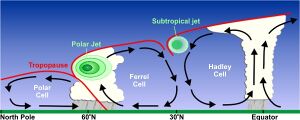
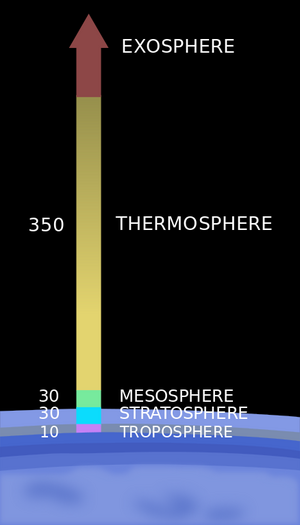
The tropopause is the atmospheric boundary that demarcates the troposphere from the stratosphere, which are the lowest two of the five layers of the atmosphere of Earth. The tropopause is a thermodynamic gradient-stratification layer that marks the end of the troposphere, and is approximately 17 kilometres (11 mi) above the equatorial regions, and approximately 9 kilometres (5.6 mi) above the polar regions.
Definition
Rising from the planetary surface of the Earth, the tropopause is the atmospheric level where the air ceases to become cool with increased altitude and becomes dry, devoid of water vapor. The tropopause is the boundary that demarcates the troposphere below from the stratosphere above, and is part of the atmosphere where there occurs an abrupt change in the environmental lapse rate (ELR) of temperature, from a positive rate (of decrease) in the troposphere to a negative rate in the stratosphere. The tropopause is defined as the lowest level at which the lapse rate decreases to 2°C/km or less, provided that the average lapse-rate, between that level and all other higher levels within 2.0 km does not exceed 2°C/km.[1] The tropopause is a first-order discontinuity surface, in which temperature as a function of height varies continuously through the atmosphere, while the temperature gradient has a discontinuity.
Location
This section may be too technical for most readers to understand. (September 2018) |
The troposphere is the lowest layer of the Earth's atmosphere; it starts at the planetary boundary layer, and is the layer in which most weather phenomena occur. The troposphere contains the boundary layer, and ranges in height from an average of at the poles, to at the Equator.[2][3] In the absence of inversions and not considering moisture, the temperature lapse rate for this layer is 6.5 °C per kilometer, on average, according to the U.S. Standard Atmosphere. A measurement of the tropospheric and the stratospheric lapse rates helps identify the location of the tropopause, since temperature increases with height in the stratosphere, and hence the lapse rate becomes negative. The tropopause location coincides with the lowest point at which the lapse rate is less than a prescribed threshold.
Since the tropopause responds to the average temperature of the entire layer that lies underneath it, it is at its maximum levels over the Equator, and reaches minimum heights over the poles. On account of this, the coolest layer in the atmosphere lies at about 17 km over the equator. Due to the variation in starting height, the tropopause extremes are referred to as the equatorial tropopause and the polar tropopause.
Given that the lapse rate is not a conservative quantity when the tropopause is considered for stratosphere-troposphere exchanges studies, there exists an alternative definition named dynamic tropopause. It is formed with the aid of potential vorticity, which is defined as the product of the isentropic density, i.e. the density that is measurable by using potential temperature as the vertical coordinate, and the absolute vorticity, given that this quantity attains quite different values for the troposphere and the stratosphere.[4] Instead of using the vertical temperature gradient as the defining variable, the dynamic tropopause surface is expressed in potential vorticity units (PVU, 1 PVU = 10-6 K m2 kg-1 s-1[5]). Given that the absolute vorticity is positive in the Northern Hemisphere and negative in the Southern Hemisphere, the threshold value should be considered as positive north of the Equator and negative south of it.[6] Theoretically, to define a global tropopause in this way, the two surfaces arising from the positive and negative thresholds need to be matched near the equator using another type of surface such as a constant potential temperature surface. Nevertheless, the dynamic tropopause is useless at equatorial latitudes because the isentropes are almost vertical.[5] For the extratropical tropopause in the Northern Hemisphere the WMO established a value of 1.6 PVU,[5]: 152 but greater values ranging between 2 and 3.5 PVU have been traditionally used.[7]
It is also possible to define the tropopause in terms of chemical composition.[8] For example, the lower stratosphere has much higher ozone concentrations than the upper troposphere, but much lower water vapor concentrations, so an appropriate boundary can be defined.
Tropical Tropopause Layer Cold Trap
In 1949 Alan West Brewer proposed that tropospheric air passes through the tropopause into the stratosphere near the equator, then travels through the stratosphere to temperate and polar regions, where it sinks into the troposphere. [9] This is now known as Brewer-Dobson circulation. Because gases primarily enter the stratosphere by passing through the tropopause in the tropics where the tropopause is coldest, water vapor is condensed out of the air that is entering the stratosphere. This ″tropical tropopause layer cold trap″ theory has become widely accepted. [10] This cold trap limits stratospheric water vapor to 3 to 4 parts per million. [11] Researchers at Harvard have suggested that the effects of Global Warming on air circulation patterns will weaken the tropical tropopause layer cold trap. [12]
Water vapor that is able to make it through the cold trap eventually rises to the top of the stratosphere, where it undergoes photodissociation into oxygen and hydrogen or hydroxide ions and hydrogen.[13] [14] This hydrogen is then able to escape the atmosphere. Thus, in some sense, the tropical tropopause layer cold trap is what prevents Earth from losing its water to space. James Kasting has predicted that in 1 to 2 billion years, as the Sun increases in luminosity, the temperature of the Earth will rise enough that the cold trap will no longer be effective, and so the Earth will dry out.[15]
Phenomena
The tropopause is not a fixed boundary. Vigorous thunderstorms, for example, particularly those of tropical origin, will overshoot into the lower stratosphere and undergo a brief (hour-order or less) low-frequency vertical oscillation.[16] Such oscillation results in a low-frequency atmospheric gravity wave capable of affecting both atmospheric and oceanic currents in the region.
Most commercial aircraft are flown in the lower stratosphere, just above the tropopause, during the cruise phase of their flights; in this region, the clouds and significant weather perturbations characteristic of the troposphere are usually absent.
See also
References
- ↑ Lua error in Module:Citation/CS1/Configuration at line 2123: attempt to index field '?' (a nil value).
- ↑ Lua error in Module:Citation/CS1/Configuration at line 2123: attempt to index field '?' (a nil value).
- ↑ Lua error in Module:Citation/CS1/Configuration at line 2123: attempt to index field '?' (a nil value).
- ↑ Lua error in Module:Citation/CS1/Configuration at line 2123: attempt to index field '?' (a nil value).
- ↑ 5.0 5.1 5.2 Lua error in Module:Citation/CS1/Configuration at line 2123: attempt to index field '?' (a nil value).
- ↑ Lua error in Module:Citation/CS1/Configuration at line 2123: attempt to index field '?' (a nil value).
- ↑ Lua error in Module:Citation/CS1/Configuration at line 2123: attempt to index field '?' (a nil value).
- ↑ Lua error in Module:Citation/CS1/Configuration at line 2123: attempt to index field '?' (a nil value).
- ↑ Lua error in Module:Citation/CS1/Configuration at line 2123: attempt to index field '?' (a nil value).
- ↑ Lua error in Module:Citation/CS1/Configuration at line 2123: attempt to index field '?' (a nil value).
- ↑ Lua error in Module:Citation/CS1/Configuration at line 2123: attempt to index field '?' (a nil value).
- ↑ Lua error in Module:Citation/CS1/Configuration at line 2123: attempt to index field '?' (a nil value).
- ↑ Lua error in Module:Citation/CS1/Configuration at line 2123: attempt to index field '?' (a nil value).
- ↑ Lua error in Module:Citation/CS1/Configuration at line 2123: attempt to index field '?' (a nil value).
- ↑ Lua error in Module:Citation/CS1/Configuration at line 2123: attempt to index field '?' (a nil value).
- ↑ Lua error in Module:Citation/CS1/Configuration at line 2123: attempt to index field '?' (a nil value).
Bibliography
- Andrews, D. G.; Holton, J. R.; Leovy, C. B. (1987). R., Dmowska; Holton, J. R. (eds.). Middle Atmosphere Dynamics. Academic Press. p. 371. ISBN 978-0-12-058576-2
- Panchev, Stoǐcho (1985) [1981]. Dynamic meteorology. D. Reidel Publishing Company. ISBN 978-90-277-1744-3
- Petty, Grant W. (2008). A First Course in Atmospheric Thermodynamics. Madison, WI: Sundog Publishing. ISBN 978-0-9729033-2-5
External links
Lua error: bad argument #2 to 'title.new' (unrecognized namespace name 'Portal').

